


Mahakumbh 2025 Survey
Bee Designs created a custom high-performance survey application with a central analytics dashboard designed specifically for mega-event data processing.
1. Geo-Enabled Mobile Survey App
Real-time GPS lock on every survey submission
Auto-check for duplicate entries based on mobile, name, or device
Offline mode for locations with low connectivity
Super-fast form structure optimized for high crowd scenarios
2. Visitor Count System
Our team deployed a dedicated module to track:
Real-time footfall
Peak hour patterns
Zone-wise crowd distribution
Daily visitor trends
3. Short Visitor Profile Module
Pilgrim preference data included:
Travel mode
Food preferences
Stay preferences
Activity participation
Age group, gender, region, etc.
Sentiment indicators
Religious engagement insights
4. High-Volume Data Engine
A customized backend database was engineered to handle:
3,00,000+ live records
Instant duplicate detection
Real-time reporting without downtime
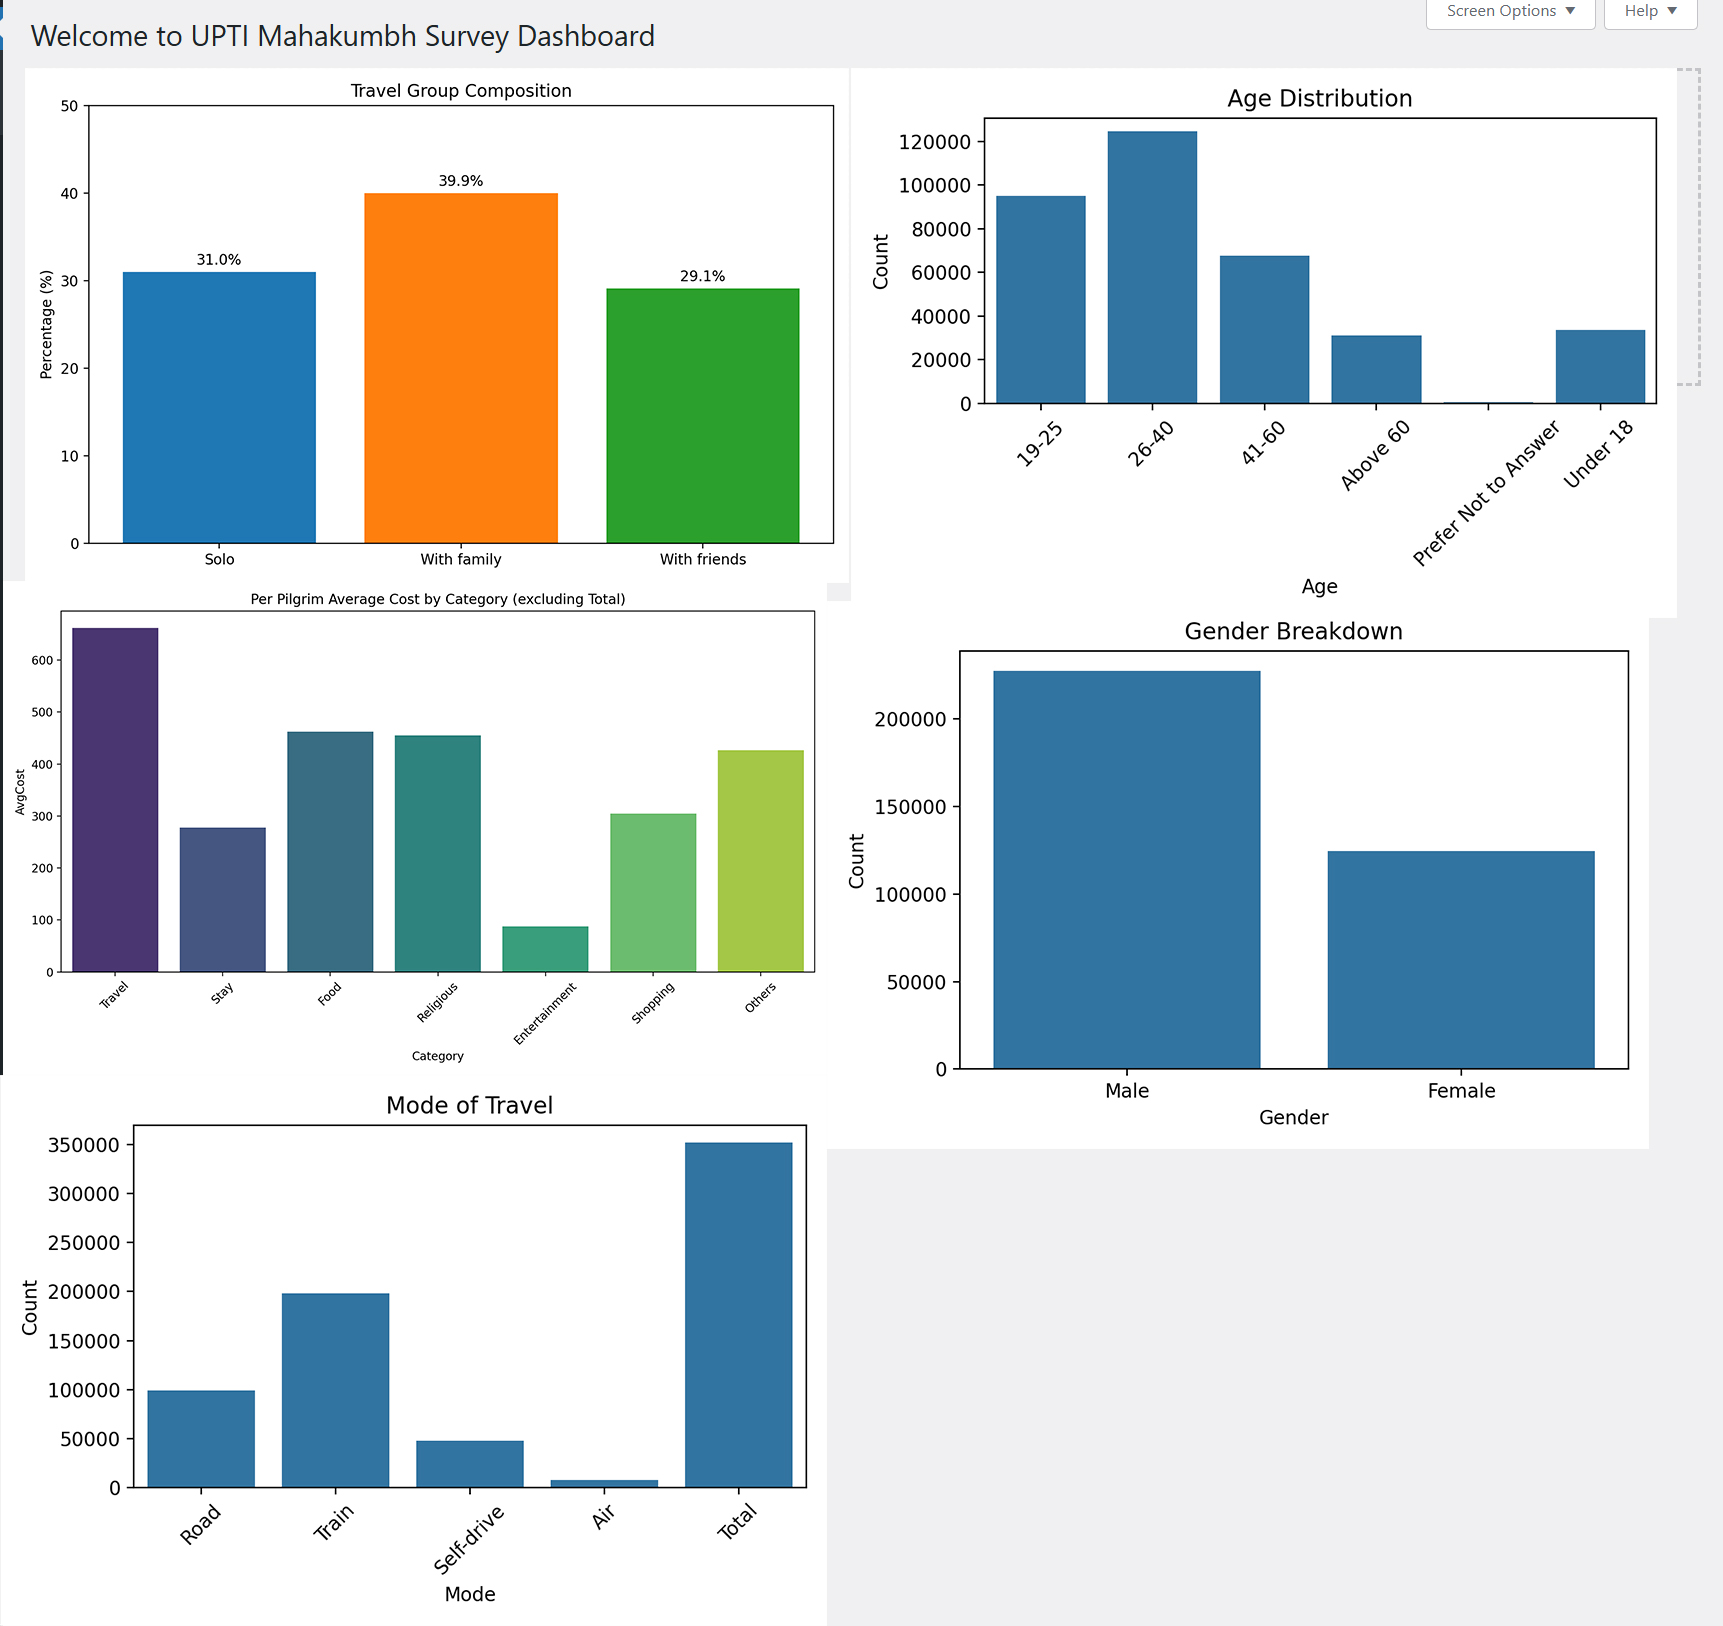
5. Analytics Dashboard for Tourism Officials
A web-based dashboard provided:
Day-wise/hour-wise footfall reports
Pilgrim behaviour analytics
Exportable Excel/PDF reports
Trend comparison charts
Auto-generated monthly & quarterly reports
Execution Strategy
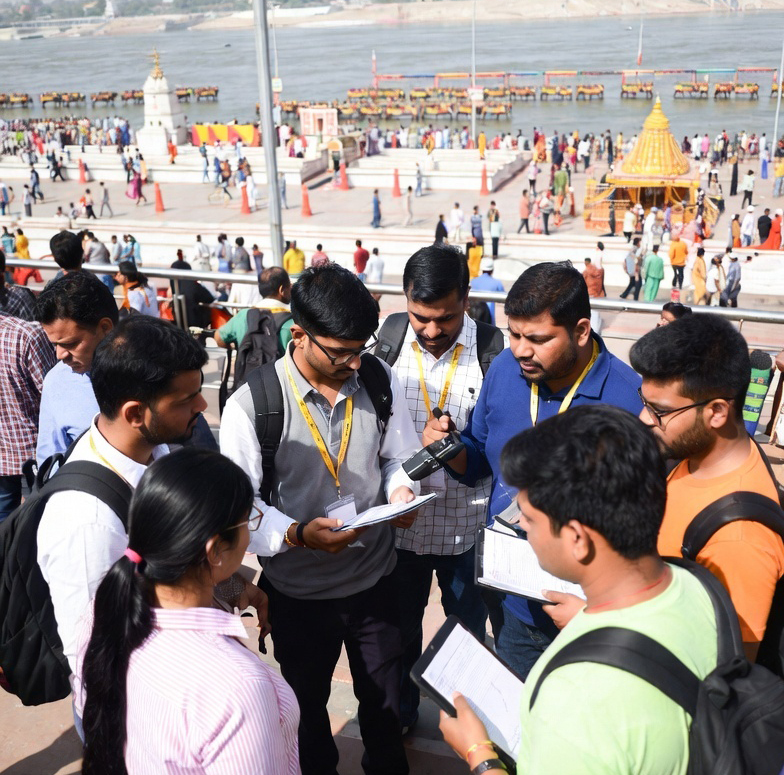
1. Multi-Team Deployment
Survey operations ran across multiple zones, each equipped with our mobile application.
2. Field Training
We conducted rapid training sessions ensuring all personnel could handle large crowd conditions effectively.
3. Automated Data Sync
Data was synced in real-time whenever network availability returned.
4. Continuous Monitoring
Our backend team provided 24×7 technical supervision to ensure uptime and data integrity.
Key Achievements
 3,00,000+ Verified Visitor Surveys Collected
All with GPS tracking, duplication checks, and validated form entries.
Real-Time Insights During the Event
Officials used our dashboard to make operational decisions on:
Crowd movement
Traffic control
Pilgrim assistance
Resource allocation
High-Level Reports Delivered
Monthly and quarterly analytics helped in:
Tourism planning
Future Kumbh estimations
Policy decisions
Infrastructure resource assessmen